


Building a HubSpot RevOps system that works as hard as the team using it
Six months. Four operational pillars. A CRM rebuilt from the ground up — 132,000 contacts, 13 live workflows, and a revenue engine the team can finally see clearly.
- 01CRM Data Foundation & Lifecycle ArchitectureData, Scoring, Properties
- 02Sales Operations SystemPipeline, Demos, Contracts, Tasks
- 03Customer Onboarding & Service OperationsCredentialing, Onboarding, NPS
- 04Reporting InfrastructureDashboards, Visibility, Automation
Building the Foundation Every Other System Depends On
Lifecycle stages, lead scoring, property architecture, and a data overhaul across 132,000 contacts and 79,000 companies. Nothing built on top of this works without getting this layer right first.
When we took over Rent Butter’s HubSpot in November 2025, lifecycle stages and scoring were in place — but neither was working as intended. Stage definitions were inconsistent, scoring models weren’t driving reliable action, and hundreds of open deals had been sitting untouched for months.
The result: a 132,000-contact database that couldn’t reliably surface who was worth calling, a pipeline full of noise, and reporting that measured activity rather than reality. Before building anything new, we rebuilt the foundation.
Lifecycle Stages — Redefined and Fully Automated
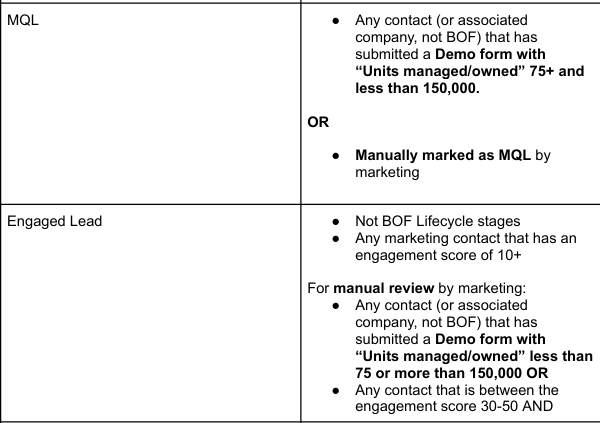
We rewrote the definition of every lifecycle stage, documented them formally, then built automation to enforce them consistently across the entire database. Stages are never updated manually — the system keeps them current based on deal activity, form submissions, and scoring thresholds.
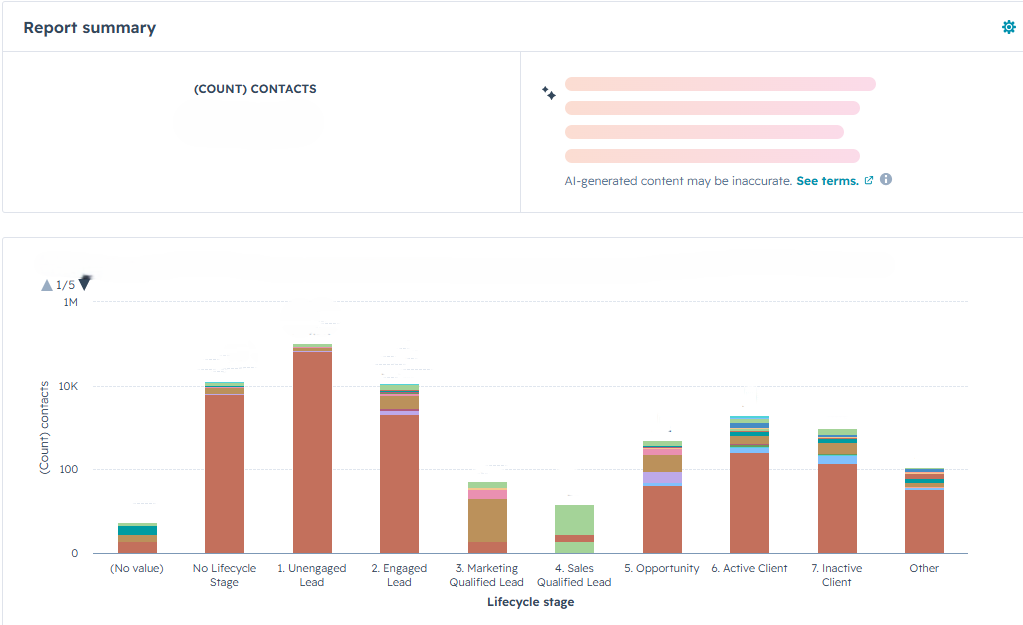
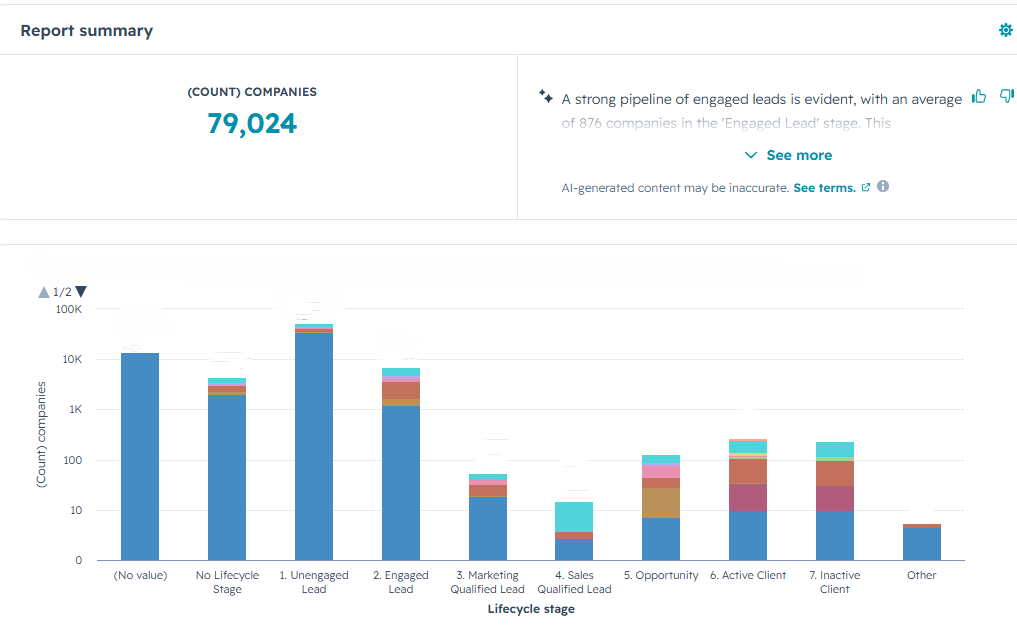
Company-level: Active Client, Inactive Client, Opportunity, and others — each with precise, documented entry criteria. Contact-level: SQL, MQL, Engaged Lead (score 10+), Unengaged Lead (score 0–9), and No Lifecycle Stage for hard bounces and ICP disqualifications.
Lead Scoring — Two Models Built From Scratch
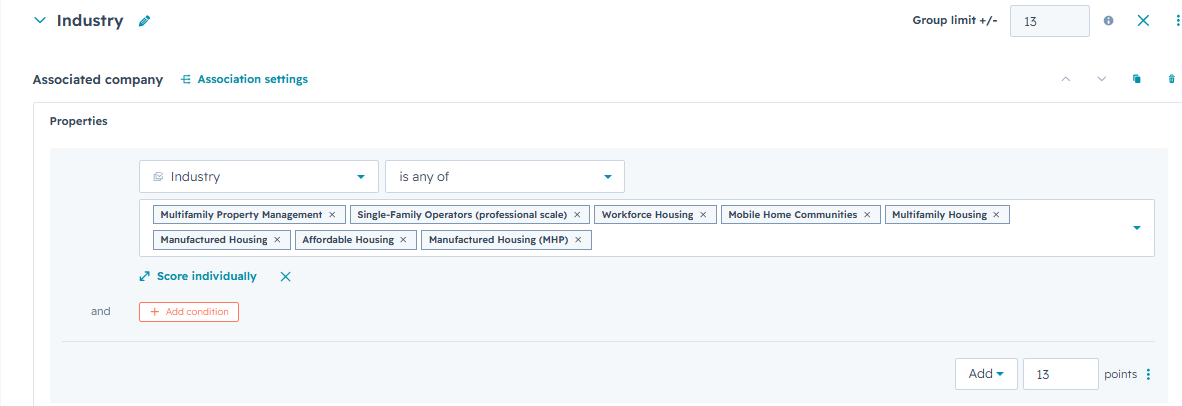
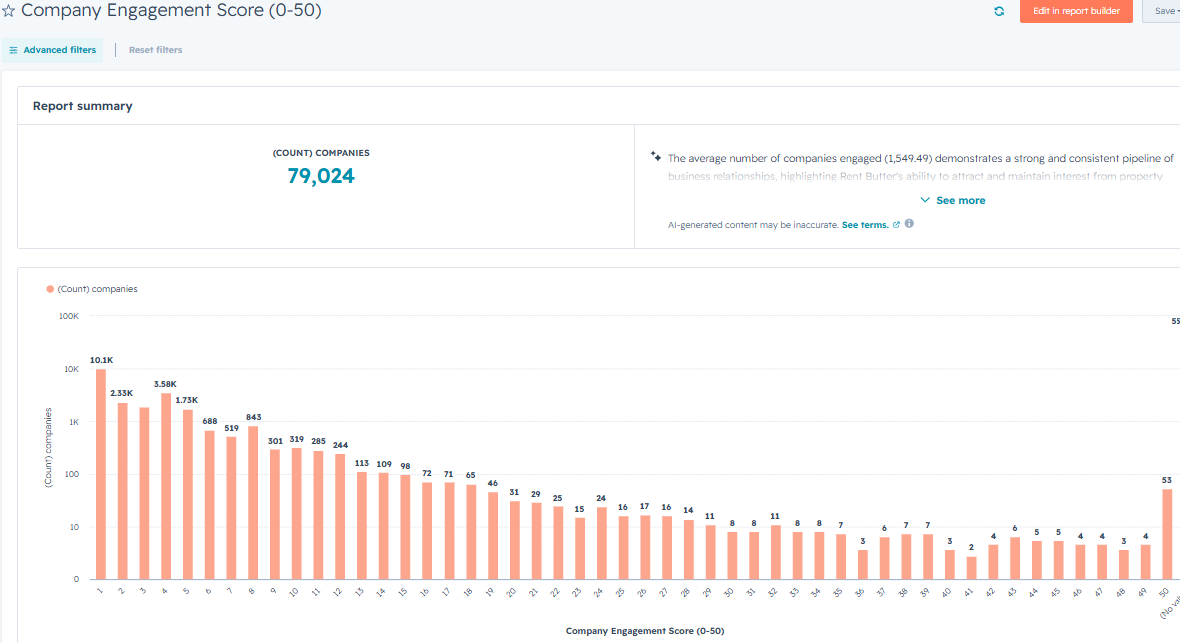
We rebuilt two independent models on a 0–50 scale, working together to surface the right contacts at the right time.
Fit Score (0–50): ICP criteria — industry, company size, property type, asset class, and job title signals that define Rent Butter’s best customers. Points assigned per criterion, scored using the associated company’s firmographic data.
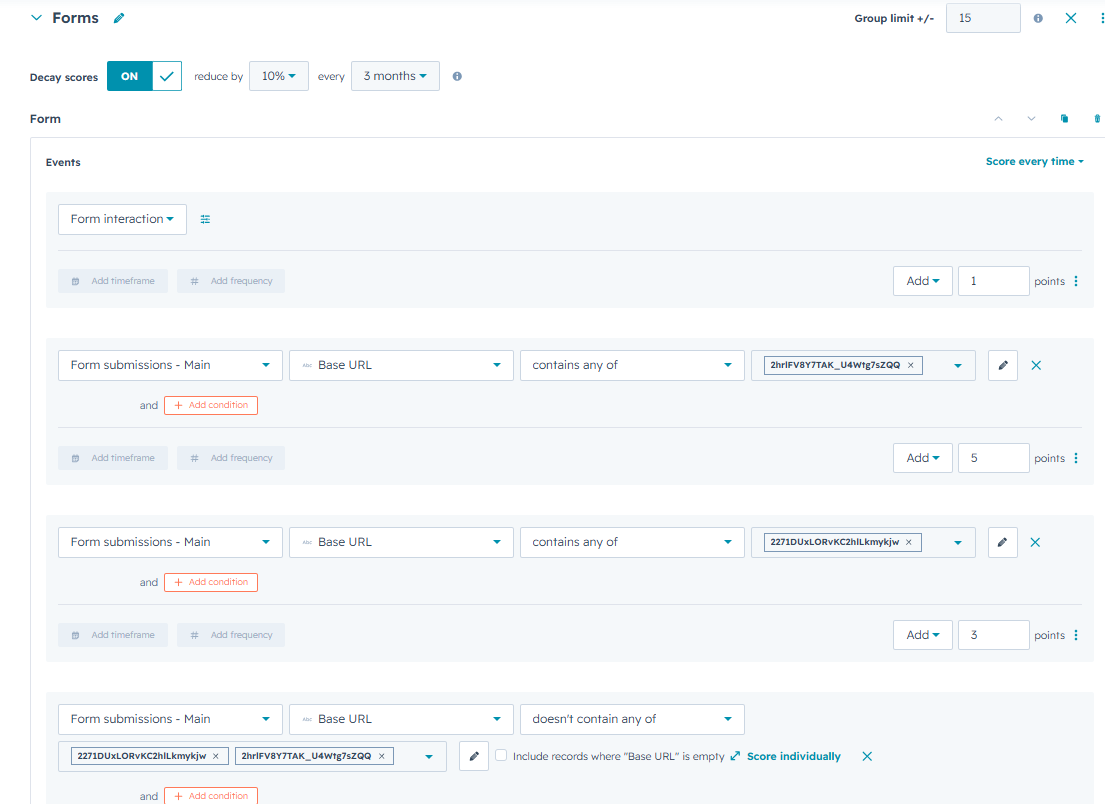
Engagement Score (0–50): Behavioral signals — email opens, form submissions, page visits — with 10% quarterly decay so stale contacts don’t hold inflated scores. Because HubSpot’s native score has no hard cap, we built a custom calculated property that normalizes it to a clean 0–50 scale.
Lead Resolution — A Structured Decision for Every Lead
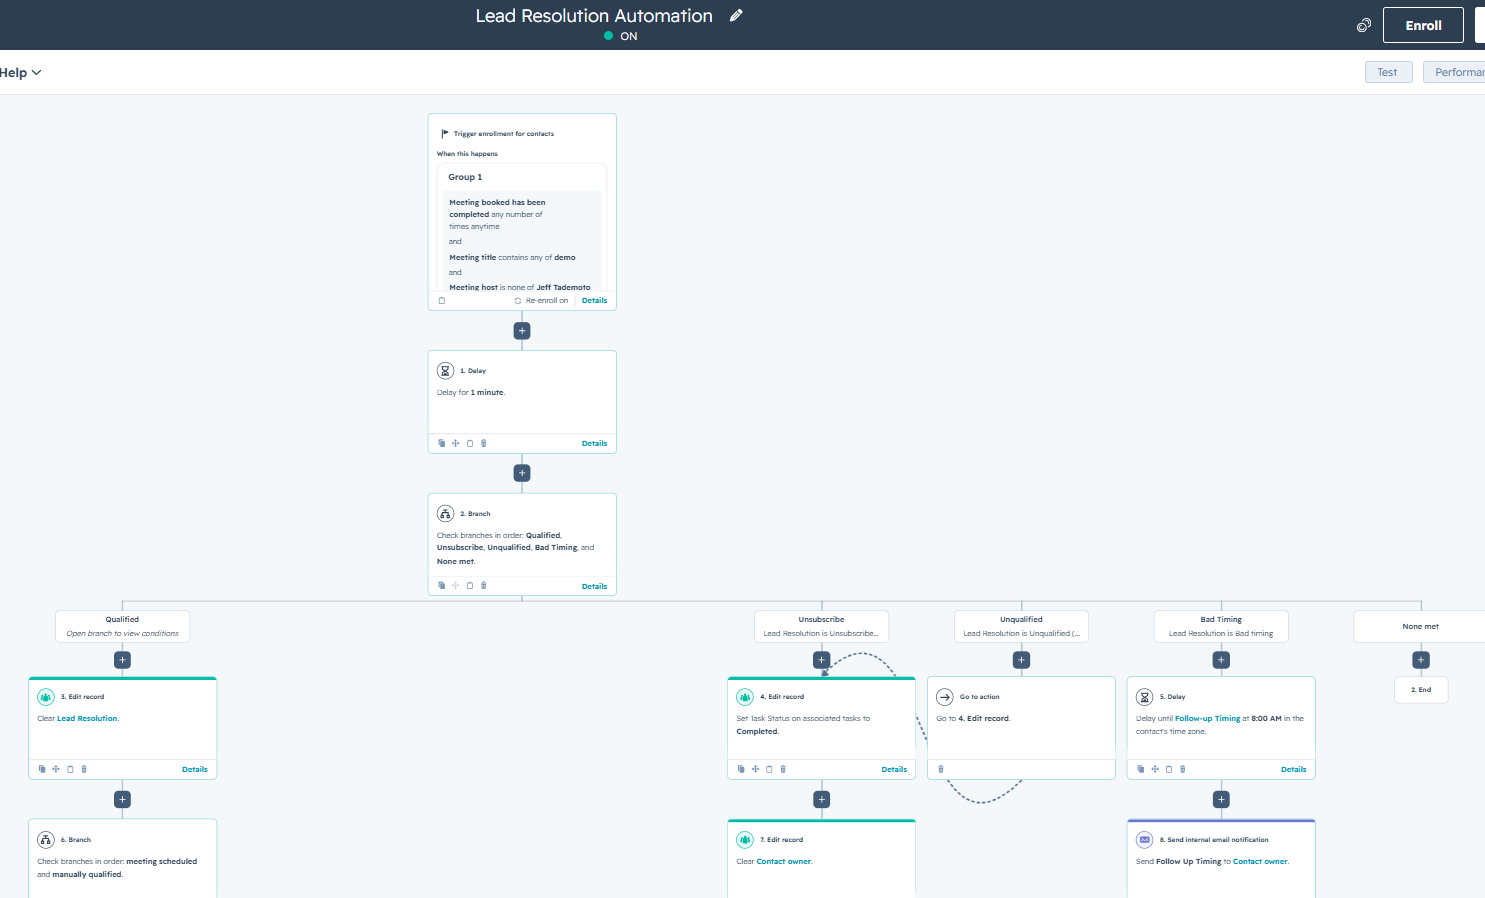
We built a custom contact property called Lead Resolution giving reps a structured set of decisions on every lead. Each option triggers specific automations immediately: stage changes, deal creation, task assignment, owner syncing, and notifications — no manual follow-through required.
Options: Qualified (auto-creates a deal), Bad Timing (removes from view until a set follow-up date, auto-tasks on that date), Unqualified — Back to Marketing (returns contact to nurture), and Unsubscribe (Permanent).
Property Architecture & Data Cleanup
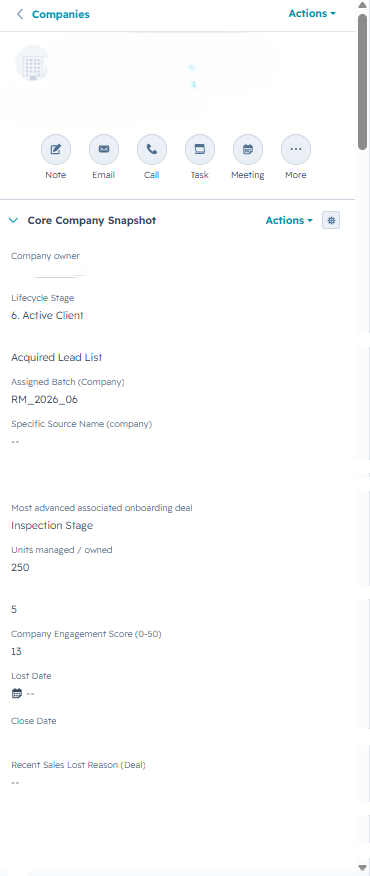
We rebuilt the property structure across contacts, companies, and deals. Company records now surface key account data at a glance — PMS in use, asset type, door count, projected MRR/ARR (auto-calculated), most advanced sales deal stage, and most advanced onboarding deal stage, both updating automatically when associated deals move. Automated fields are read-only so bad data can’t creep back in. We also audited and closed hundreds of dead deals before launch, so every report since day one reflects an accurate baseline.
Rent Butter now has a single source of truth for 132,000 contacts and 79,000 companies — lifecycle stages always current, two scoring models running continuously, and lead routing requiring no manual coordination. The foundation now supports everything built on top of it.
A Sales Process the CRM Actually Enforces
Lead routing, pipeline stage logic, demo lifecycle management, and contract intake — and monthly closed revenue that grew 149% from January to May 2026.
Rent Butter’s sales team was running real demos and closing contracts, but the CRM wasn’t keeping up. Deal stages reflected optimism rather than qualification. Demo outcomes weren’t tracked — there was no system to capture whether a scheduled demo actually happened. Contract intake happened outside HubSpot entirely.
Forecasting was guesswork. Coaching was hard because there was no standard to coach against. We rebuilt the entire sales operations layer from scratch.
Lead Management — Routing, Assignment, Deal Creation
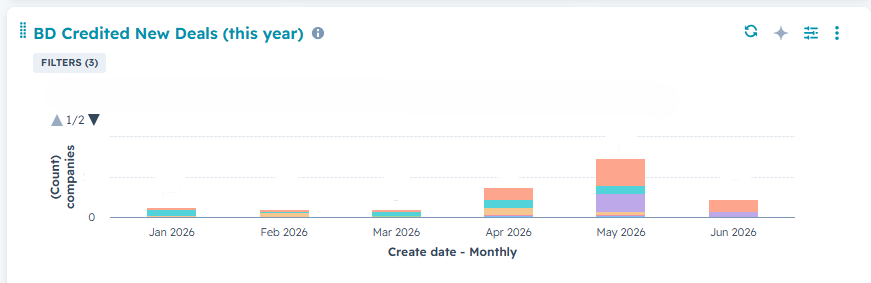
We built a structured pre-sales system that moves leads from marketing into the pipeline without manual handoffs. When a contact hits MQL status they’re automatically assigned to an owner. Deal creation is automatic when a rep sets Lead Resolution to “Qualified” or when a contact books a first meeting. BD Credit is automatically assigned at that moment, capturing attribution at conversion.
Deal Stage Entry Criteria — Documented and Enforced by Automation
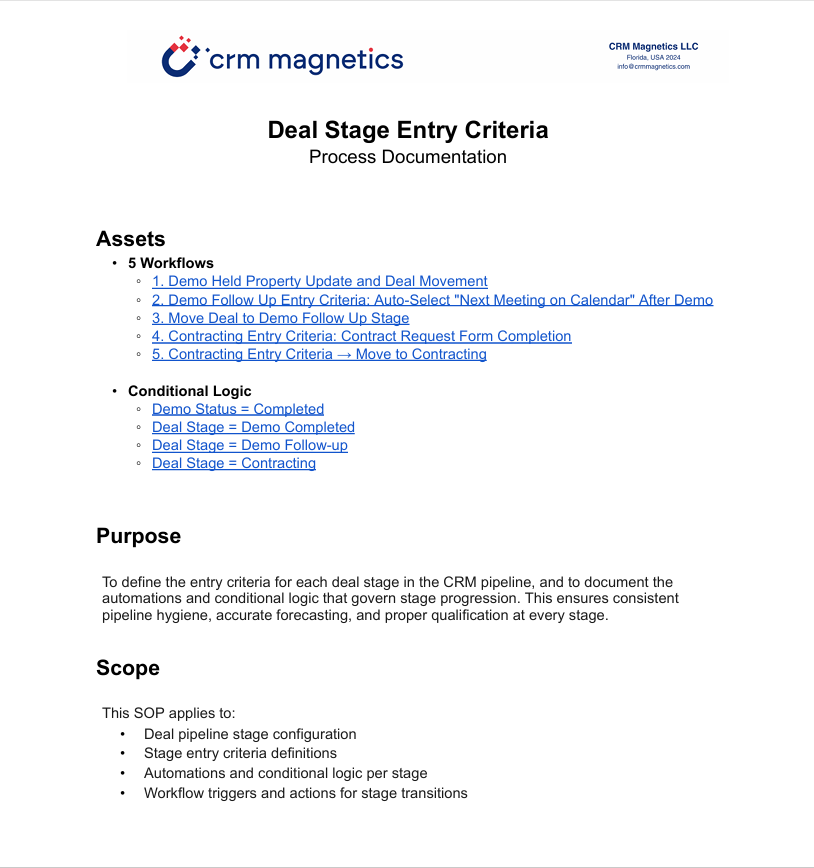
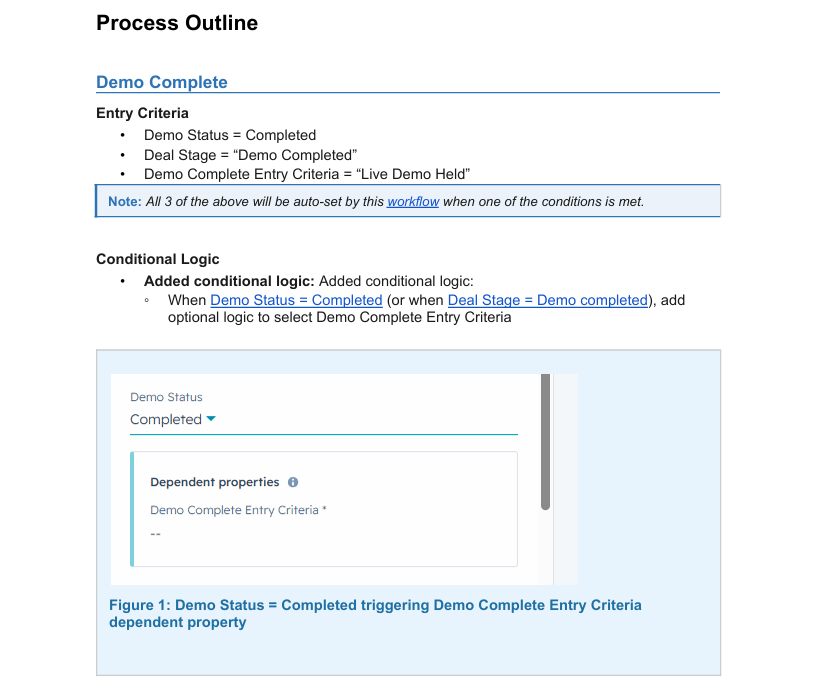
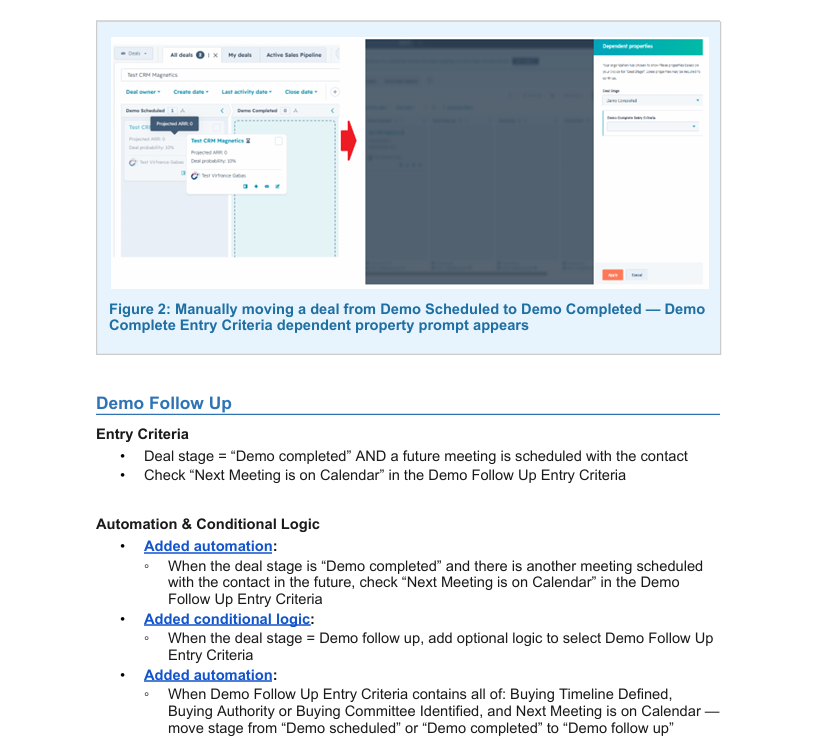
We built full process documentation alongside every automation — every stage has defined entry criteria, conditional logic, and a workflow that enforces it. Five workflows govern demo and contracting stage progression alone.
Demo Complete can be triggered three ways — a workflow monitors all three and auto-sets the others when any one fires. Demo Follow-Up advances automatically only when all three criteria are confirmed: Buying Timeline Defined, Buying Authority Identified, and Next Meeting is on Calendar. Contracting advances when verbal commitment, configuration scope, and contract signer are all confirmed.
Demo Operations — Full Lifecycle Tracking
Before this system, Rent Butter had no way to measure demo conversion rates. We built a complete demo lifecycle around five statuses — Scheduled, Completed, No Show, Rescheduled, and Canceled — and retroactively populated historical data so there was a real baseline from day one.
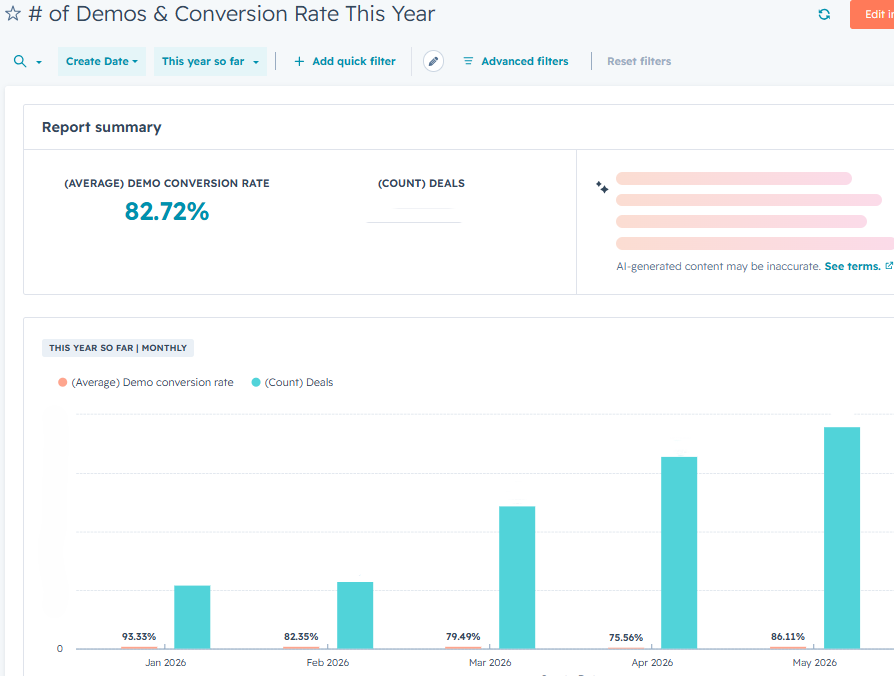
Before November 2025, this number didn’t exist. Demo conversion rate was unmeasurable. We built the tracking infrastructure, populated it retroactively, and it’s now a live metric. The conversion rate started at 61% when tracking began and reached 82.5% in Q2 2026 — a 34% improvement.
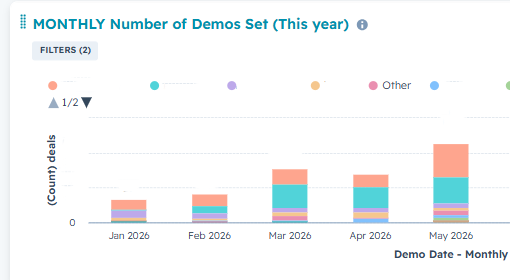
Demo Volume — A 69% Jump Q1 to Q2 2026
With the lead management system fully operational, demo volume has grown significantly. From Q1 to Q2 2026, demos set grew 69% quarter over quarter — with May 2026 reaching the highest single-month volume on record. The chart below shows the consistent upward trend in pipeline activity as the system came fully online.
BD Credit Tracking — Attribution at the Source
Task Management — Cleared and Rebuilt
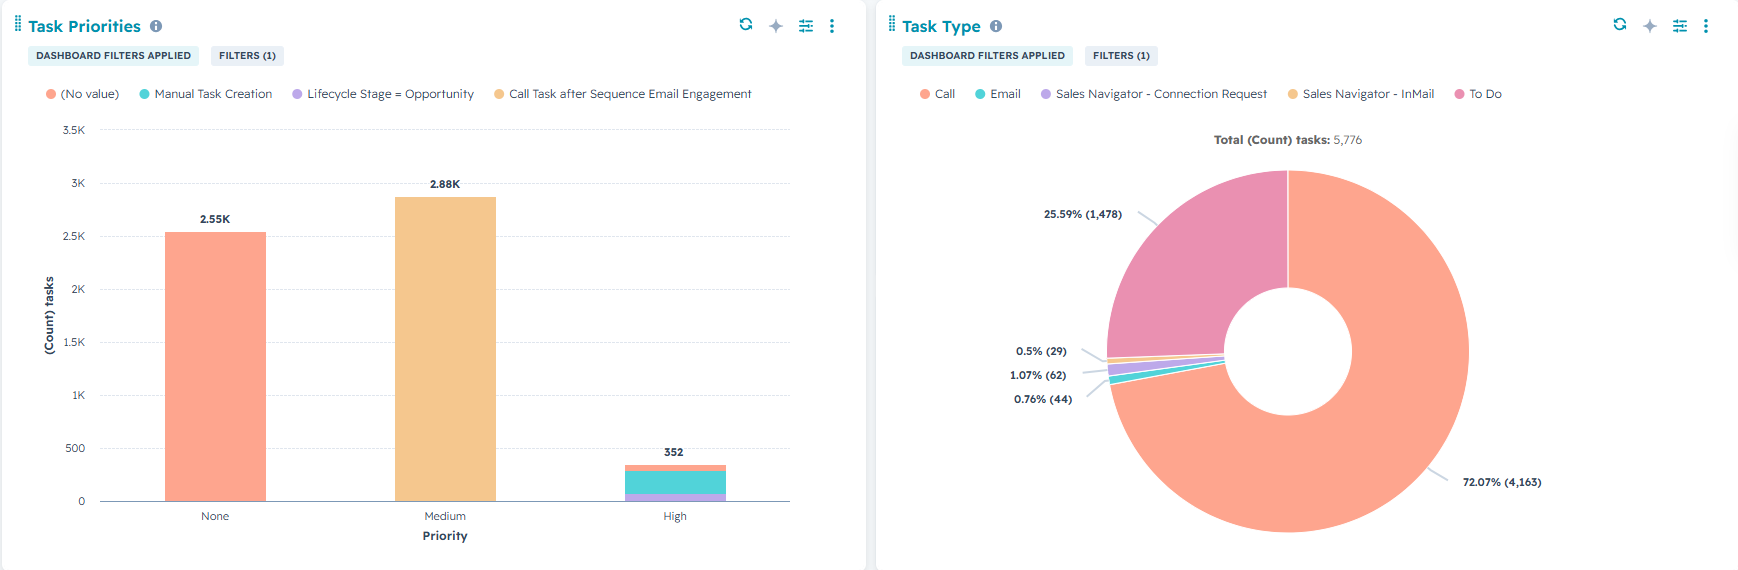
We audited all existing task workflows and found significant noise — tasks assigned to deactivated users, obsolete workflows still firing, a backlog with no path to completion. We cleared it, launched a task prioritization workflow, and built three standardized views: Past Due, Due This Week, and All Incomplete. 5,776 active tasks — now organized, prioritized, and actionable.
Contract Operations — Intake Inside HubSpot
We built a HubSpot intake form capturing everything needed for billing on submission. Association labels set automatically, billing email auto-populates, and PandaDocs was aligned with this flow. The full contract process now runs through one connected system.
Monthly closed revenue grew 149% from January to May 2026. Demo conversion tracked live at 82.5% in Q2 — up from 61% when we first built the tracking system. BD attribution captured automatically at conversion. The data is now clean enough to support real forecasting, not just activity reporting.
From Signed Contract to Active Client — Automatically
A complete post-sale system: credentialing automation, keyword-triggered onboarding stages, a custom franchise intake track, and Rent Butter’s first NPS measurement infrastructure.
Every new customer needs to clear compliance credentialing before going live, then complete a structured four-call onboarding sequence. Before this system, that entire process lived outside HubSpot. Follow-ups were inconsistent, visibility into client progress required asking someone directly, and a deal marked “Contract Signed” looked identical to one where the client had fully onboarded and gone live.
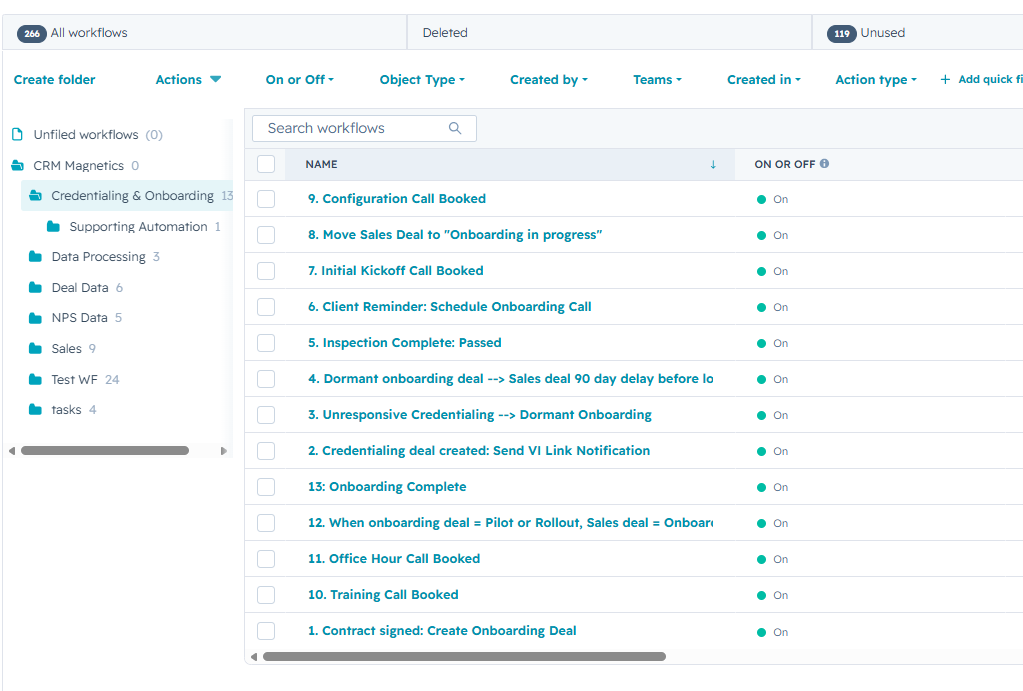
13 Live Workflows — The Complete Post-Sale System
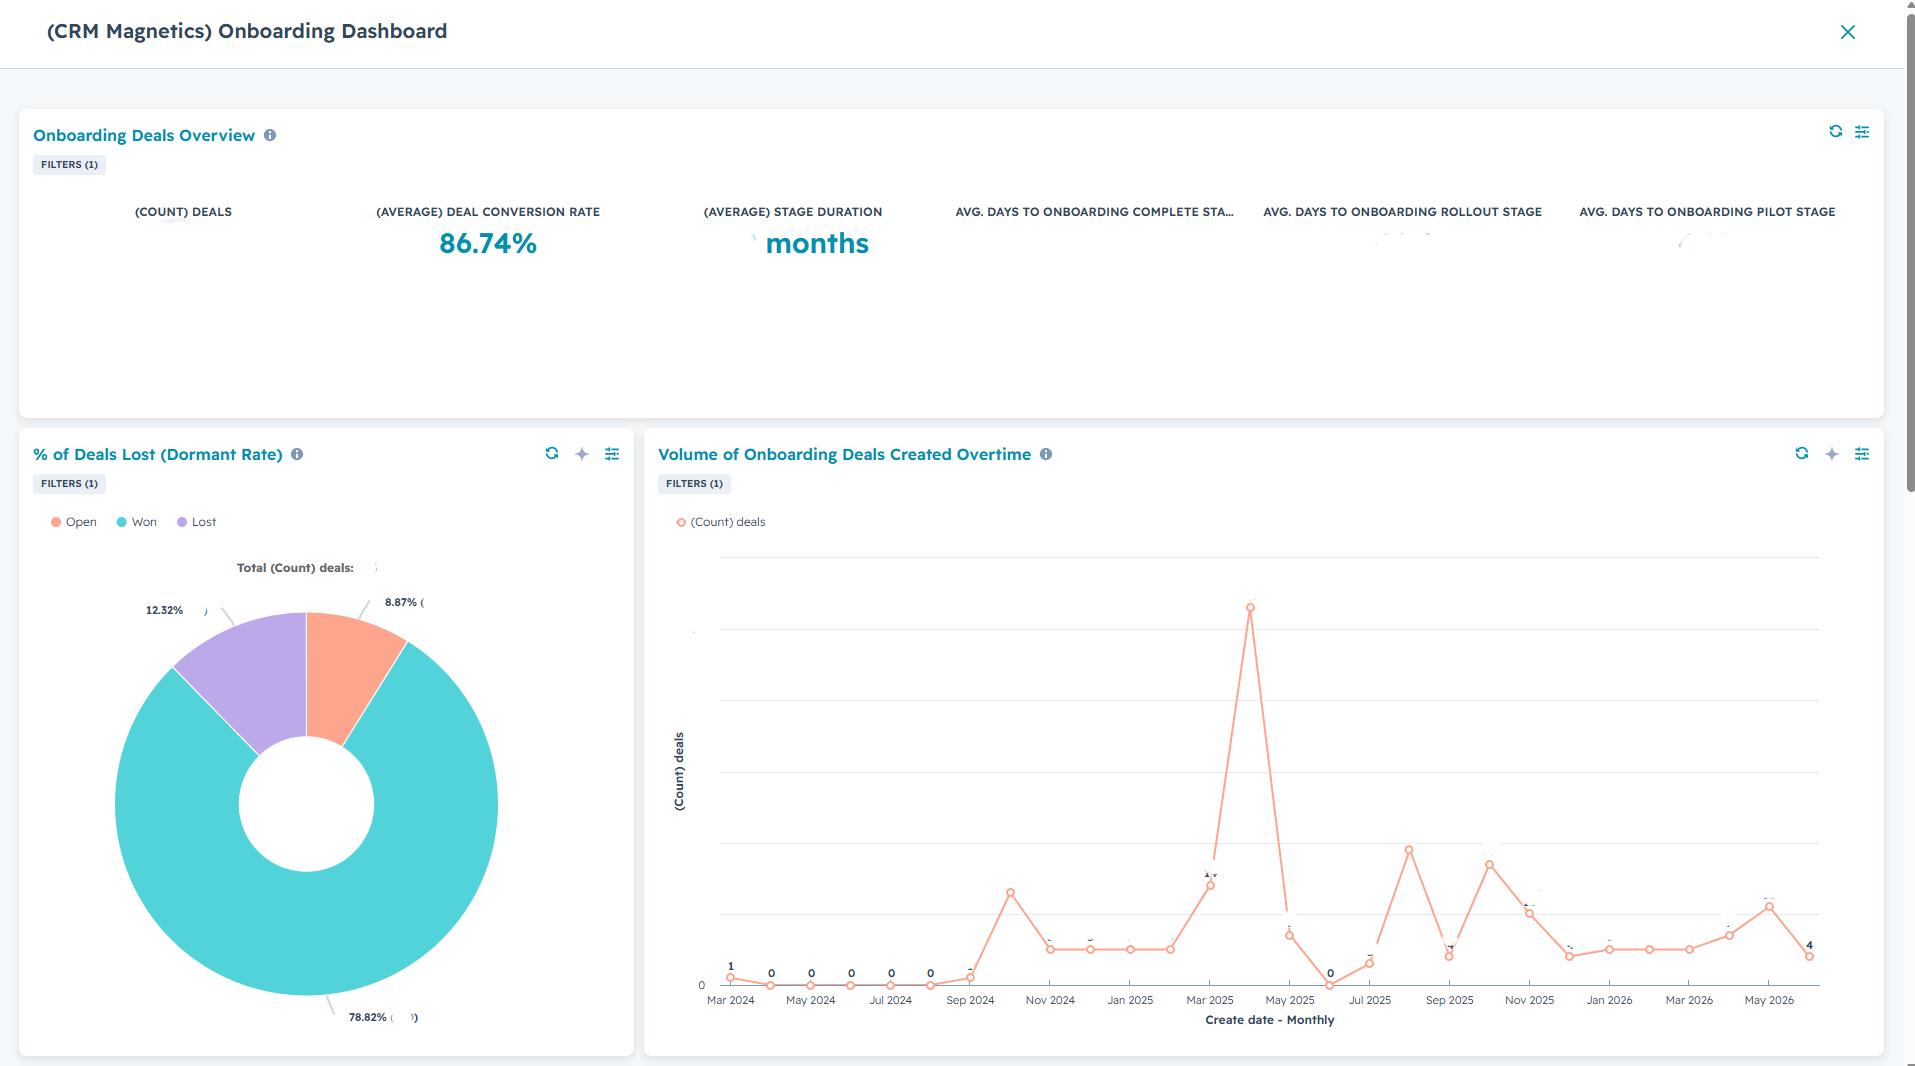
When a deal moves to “Contract Signed,” two pipelines spin up simultaneously: a Credentialing deal and an Onboarding deal, both linked to the original sales deal via HubSpot association labels. Unresponsive clients auto-move to Dormant; a deal dormant 90 days auto-closes as Lost. When the credentialing inspection is complete, three things fire simultaneously: credentialing closes, the welcome email sends, and the onboarding deal advances.
Onboarding Call Sequence — Keyword-Triggered Stage Management
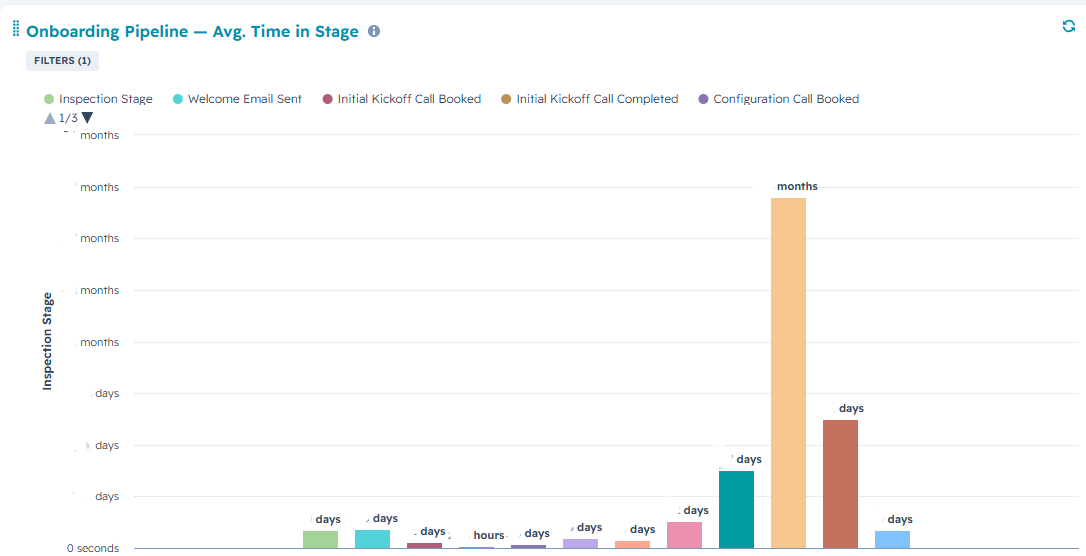
Clients complete four onboarding calls: Kickoff, Configuration, Training, and Office Hours. Stage tracking is automated via meeting link keywords — booking through a “kickoff” link auto-advances the onboarding deal and moves the sales deal to “Onboarding In Progress.” Three automated emails: welcome, onboarding reminder (fires 3 days after welcome if no call scheduled), and onboarding complete.
Franchise Onboarding — Custom Intake Track
We built a dedicated track for a national property management franchise network. A single form submission auto-creates a deal in HubSpot — named, assigned, priced, and moved directly to Onboarding In Progress.
NPS Infrastructure — Built From Scratch
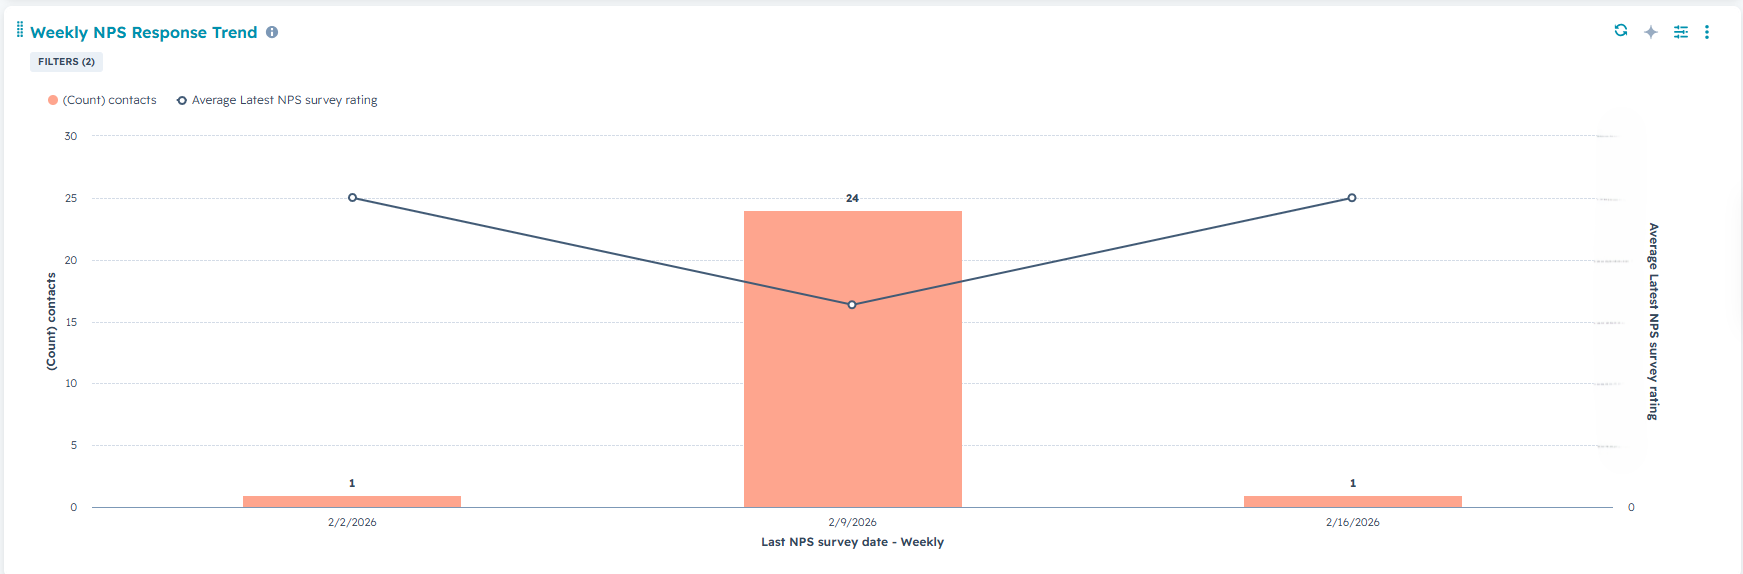
Rent Butter had never measured customer satisfaction before. We built the complete NPS infrastructure: survey deployment, automated sentiment property population at the contact level, and a live dashboard tracking response trends week over week. The value is the ongoing capability to measure and act on customer sentiment — not a single data point, but a recurring feedback loop.
Rent Butter can close a deal and trust that the entire post-sale process unfolds automatically. The sales pipeline accurately reflects post-sale reality for the first time, making client health tracking and revenue recognition meaningful rather than approximate.
From Gut Feel to Ground Truth
Six dashboards, model reports for every object, automated account-level intelligence, and stagnant deal alerts. Reporting is only as good as the data underneath it.
Before November 2025, pipeline health came from whatever HubSpot’s default views happened to surface — fragmented, inconsistent, and disconnected from how the business actually worked. We built the reporting infrastructure last, after the data architecture was in place, so every number it surfaces reflects something real.
Model Reports — A Consistent Foundation
Before building dashboards, we created model reports: pre-configured templates for each HubSpot object with the right data sources already set up. When the team needs a new report, they clone the relevant model and customize — rather than starting from scratch every time.
Six Dashboards, Each Answering One Question
Contacts Dashboard — 132,093 contacts by lifecycle stage, real time. Zero manual maintenance.
Companies Dashboard — 79,024 companies with live most-advanced sales and onboarding deal stage, pulled automatically from associated records.
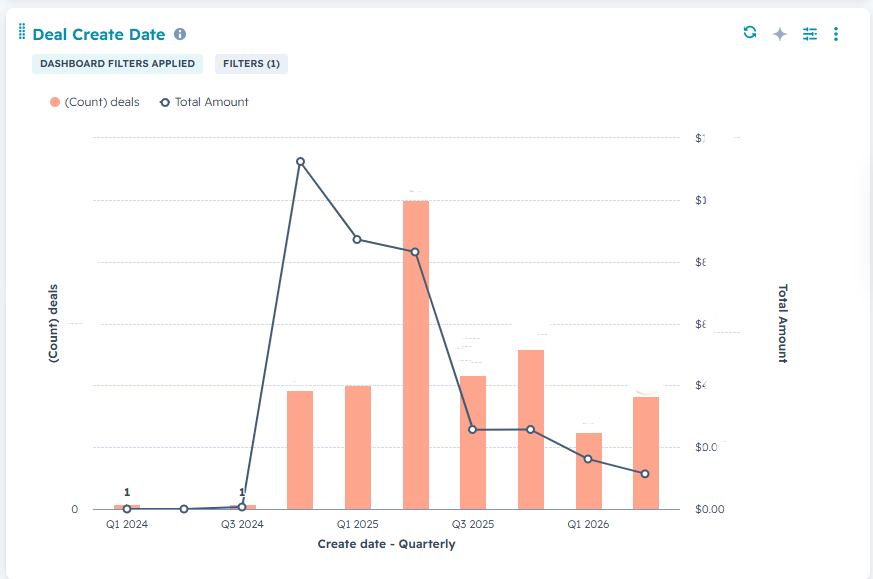
Deals Dashboard — Volume and value by quarter, BD attribution, stagnant deal alerts for anything dormant 6+ months.
Tasks Dashboard — Completion velocity, overdue counts, activity distribution by user.
Onboarding Dashboard — 86.7% conversion rate tracked in real time, with stage-by-stage timing.
NPS Dashboard — Response trends and sentiment, updated automatically after every survey run.
Automated Account-Level Intelligence & Stagnant Deal Alerts
Most Advanced Associated Sales Deal and Most Advanced Associated Onboarding Deal update automatically on every company record. Any deal with no forward movement in 6 months triggers an automated rep notification and surfaces on the Deals Dashboard. The pipeline can’t hide stagnation anymore.
Rent Butter’s leadership can open a dashboard and see what’s actually happening. The dashboards didn’t create this visibility — the clean data architecture underneath them did. The reporting makes it legible.
Ready to build this in your HubSpot?
We take on a small number of clients at a time. If this work looks like what your team needs, let’s talk.
Get in touch →