


Blog Details
ROAS vs Keep Rate: Why Apparel Ads Pay for Returns
- November 9 2026
- Nikias Kray
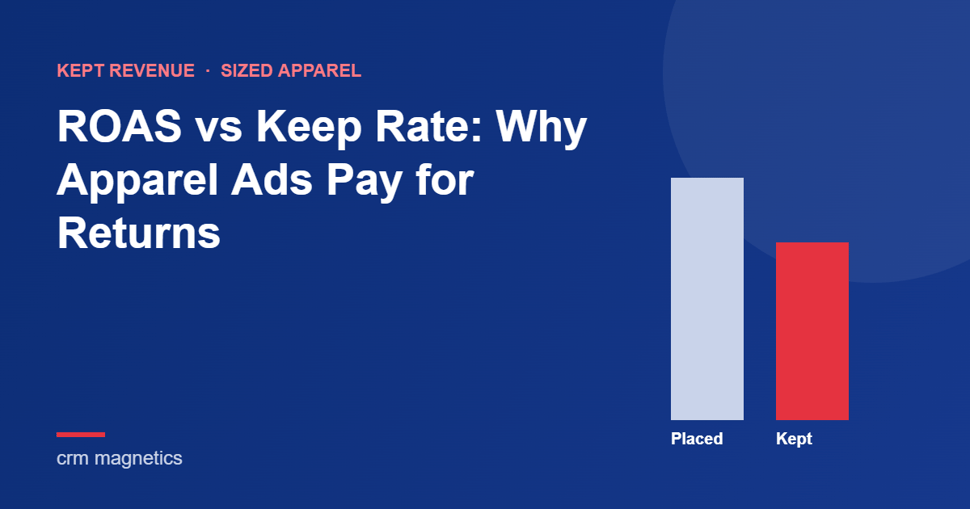
ROAS tells you how much revenue your ads produced at checkout. Keep rate tells you how much of that revenue was still yours once the returns came back. For brands that sell scrubs, uniforms, workwear, footwear or anything else where the customer picks a size, those two numbers can drift far apart. Google Ads and Meta only ever see the first one.
We see the same pattern in almost every sized-apparel account we audit. ROAS looks fine. Revenue grows. Margin doesn't follow. The ad platforms are doing exactly what they were told: find more orders placed. The business, meanwhile, only gets paid on orders kept.
Key Takeaways
- Keep rate is the share of order value customers keep after the return window closes. Kept revenue is revenue net of returns and refused deliveries.
- ROAS is measured at the moment of purchase. A return weeks later changes your bank balance but not your ROAS.
- Smart bidding on Google Ads and value optimization on Meta chase whatever conversion you report. Report placed orders and they will happily find more customers who send things back.
- Sized products carry most of the risk. At one medical apparel retailer we work with, items with a size came back at about three times the rate of items without one.
- When that retailer's reporting and bidding moved from placed orders to kept orders, keep rate rose 18% within two months on an unchanged budget.
What Is Keep Rate?
Keep rate is the percentage of orders, or of order value, that customers keep once the return window has closed, after returns and refused deliveries are taken out. It is the mirror image of return rate: whatever share of order value does not come back is your keep rate.
Kept revenue is the revenue that stays in the business after returns and refusals. Divide ad spend by kept revenue instead of gross revenue and you get your real ad cost of sale.
For ad decisions, measure both by value rather than by order count. A customer who orders the same pants in two sizes and keeps one still counts as a "kept order" by count, but half the revenue went back to the warehouse. Value catches that. Count doesn't.
Keep rate captures what happens after checkout: whether the size was right, whether the product matched what the ad promised, and whether the customer accepted the delivery. ROAS stops measuring before any of that.
What Is the Difference Between ROAS and Keep Rate?
ROAS measures revenue at the moment of purchase. Keep rate measures how much of that revenue survives the return window. One is a checkout metric, the other is an outcome metric, and only the outcome pays the bills.
The gap exists because of plumbing. The purchase event fires on the thank-you page or from your server when the order is placed. Returns are logged weeks later in a different system: the returns app, the warehouse, a customer service ticket. Nothing connects the two back to the ad platform. So the customer who returned half the order still looks like a success, and the platform goes looking for more people like them.
Your reports overstate revenue. The dashboard counts money that has since been refunded, and budget follows that number.
Your bidding learns the wrong lesson. Google Ads Smart Bidding and Meta's value-based optimization can't tell a buyer who keeps from a buyer who returns if both show up as full-value purchases.
Your diagnosis goes in the wrong direction. When margin stalls, the instinct is to blame traffic quality. In the case below, the traffic mix had barely moved. What had changed was what happened after the order.
How Much Do Returns Cost per 100 Orders?
In the illustrative model below, a store with 20% returns keeps about 28% less money than a store with 6% returns, even though both show identical ROAS. This is a model, not client data. It assumes a $120 average order value, a 40% gross margin and a 14% ad cost of sale on placed orders.
| Per 100 orders | 6% returns | 20% returns |
|---|---|---|
| Orders placed | $12,000 | $12,000 |
| Actually kept | $11,280 | $9,600 |
| Gross margin on kept orders | $4,512 | $3,840 |
| Ad spend (paid on all 100 orders) | −$1,680 | −$1,680 |
| Return shipping | −$45 | −$150 |
| Left in the business | $2,787 | $2,010 |
Look at the ad spend row. You pay for every order, including the ones that come back. The advertising report isn't wrong. It is measuring the wrong moment.
Why Do Sized Products Get Returned More?
Because the customer has to guess a size, and some guesses are wrong. The ad platform has no influence over that guess, which is why tightening targeting rarely fixes a return problem.
The data makes the point quickly. In one medical apparel retailer's 2024 numbers, lab coats came back at 21.3% while bags came back at 6.1%. Across the catalog, anything with a size on the label was returned at about three times the rate of anything without one. The full category breakdown, and what to do about it, is in our guide to reducing size-related returns before the order ships.
How Do You Make Google Ads and Meta Optimize for Kept Revenue?
You change what you report to them as a conversion, you move the size decision earlier, and you judge campaigns on revenue after returns. None of it involves targeting.
- Rewire the conversion signal. Your order system or CRM tells the ad platforms which orders were kept. On Google Ads that usually means offline conversion imports or conversion adjustments matched by order ID. On Meta it usually means purchase values adjusted for expected returns, because events have to arrive close to the purchase. The setup options are covered step by step in how to send returns data to Google Ads and Meta, and the service side in our Kept Revenue overview.
- Help the customer pick the right size. Fit guidance per cut and fabric, fit cues in the creative and on the product page, and a quick check with buyers whose order sits on a size boundary before it ships.
- Report on revenue after returns. Lead the monthly report with kept revenue and ad cost of sale against it. Once leadership looks at that number, budget stops flowing to campaigns that look great on ROAS and weak on keep rate.
Case Study: What Happened When One Retailer Switched to Keep Rate?
Keep rate rose 18% within two months, with the same budget, catalog and campaigns. That is the headline from our work with an online medical apparel retailer.
CRM Magnetics has run this retailer's full digital stack since 2022. Paid search and paid social bring in 42% of site revenue and organic 30%, so the signal the ad platforms learn from shapes a large share of the business. By the third year, revenue and ROAS were up but margin was flat. Returns explained it. The return rate was 5.9% of gross sales in 2022 and 5.4% in 2023, then jumped to 18.0% in 2024 and reached about 21% in Q1 2025. None of that appeared in the ad reports.
We rewired the conversion signal around kept orders, rebuilt the size guidance and switched reporting to revenue after returns. Today the account runs at a 7.2 ROAS and a 14% ad cost of sale. The year-by-year numbers are in the Keep Rate case study.
Results depend on the store, the category and how much of the return rate comes from size and fit. We don't promise a number before we've seen your data.
Frequently Asked Questions
What is a good keep rate for an apparel brand?
There is no benchmark that fits every category. Returns depend on product type, fit, price point and return policy. The useful comparison is your own keep rate by category and by acquisition channel over time, which shows where the gap is and whether it is growing.
Is keep rate the same as return rate?
They describe the same thing from opposite sides. Return rate is the share that comes back; keep rate is the share that stays. Keep rate works better as a goal because it moves in the same direction as profit.
Should I stop using ROAS?
No. Read it next to keep rate. ROAS tells you how efficiently ads generate orders; ad cost of sale on kept revenue tells you whether those orders made money.
Can Google Ads and Meta bid toward kept orders?
Yes, with the right setup. Both optimize toward the conversions and values you send, so the work is in sending a signal that reflects kept revenue, within each platform's technical rules and time limits.
Will optimizing for keep rate reduce my sales volume?
The goal isn't to sell less. It is to stop paying the platforms to find customers who return.
Which brands benefit most from tracking keep rate?
Brands where the customer picks a size: scrubs and medical apparel, uniforms, workwear, footwear, dancewear and activewear. The case is strongest for brands already spending on paid media at scale and able to export orders and returns by category.
Find Out What Your Returns Are Costing
CRM Magnetics runs Google Ads and Meta for sized-apparel brands with kept revenue as the goal, not placed orders. On a short call we look at your return rate by category and acquisition channel and tell you honestly whether there is a gap worth fixing. Book a strategy call or read how paid media for sized apparel works.
Leave your thought here
Your email address will not be published. Required fields are marked *