Blog Details
Tracking Funnel Performance in HubSpot Dashboards
- October 20 2025
- Nikias Kray

Tracking Funnel Performance in HubSpot Dashboards
Understanding your sales funnel isn't optional — it's essential. Knowing where leads drop off, how they convert, and what your win rate looks like allows you to fine-tune your sales and marketing strategies for better results.
HubSpot’s Dashboards provide a powerful, visual way to track funnel performance, identify bottlenecks, and act on data. In this guide, we’ll walk through how to set up key reports that give you a full picture of your revenue engine.
Why Funnel Tracking Matters
A well-monitored funnel tells you:
-
Which stages are leaking leads
-
Where to improve conversion tactics
-
How sales and marketing alignment impacts deals
-
What actions lead to revenue — and which ones don’t
Without this visibility, you’re flying blind.
🔗 HubSpot’s State of Sales report highlights that 40% of reps say getting visibility into sales performance is a top challenge — and dashboards solve this head-on.
Key Funnel Reports to Build in HubSpot
Here are the must-have reports for tracking funnel health:
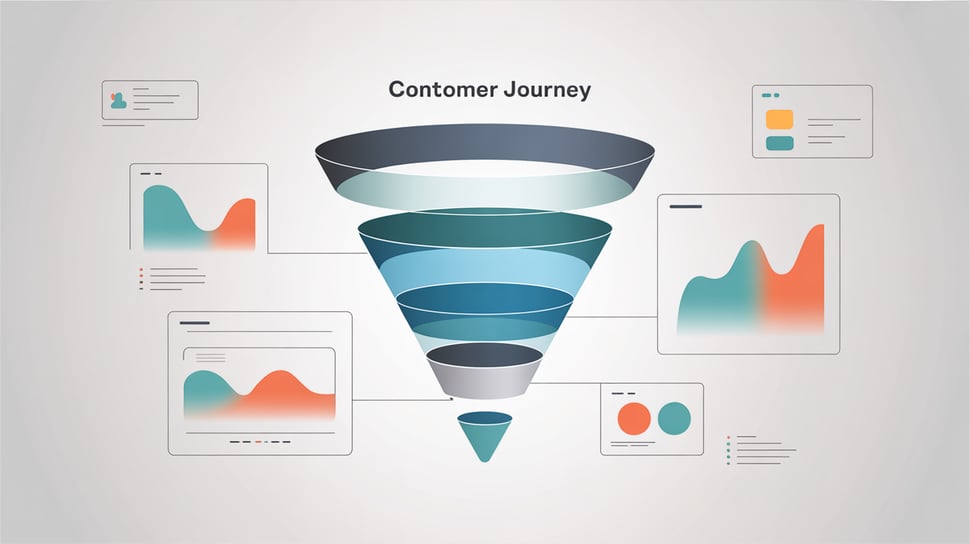
1. Deal Stage Funnel (Drop-Off Analysis)
This report shows how many deals enter each stage and how many exit to the next.
-
Metric: Conversion rate between stages
-
Use it to: Spot major drop-offs (e.g., Discovery → Demo)
-
Action: Investigate objection handling, rep follow-up delays, or qualification issues
How to build it:
Use the "Funnel Report" under Custom Reports → Deal-based → Funnel visualization.
2. Conversion Rate by Lead Source
Find out which sources generate quality leads that move through the funnel — not just quantity.
-
Metric: Source-to-close conversion rate
-
Use it to: Double down on high-performing channels
-
Action: Reduce investment in low-converting traffic
Example: You may see that webinar leads convert at 12%, while paid social converts at 2%.
3. Win Rate by Deal Owner or Team
See how performance varies across reps or teams.
-
Metric: Deals won vs. deals created
-
Use it to: Identify coaching opportunities or share successful strategies
-
Action: Standardize winning behavior using playbooks
4. Average Time in Each Deal Stage
Understand where deals stall and why.
-
Metric: Days spent per stage
-
Use it to: Identify stages that slow down deals
-
Action: Automate next steps or create task reminders
Pro Tip: Tie in Sales Sequences to improve stage progression.
5. Forecast Accuracy & Revenue by Funnel Stage
Monitor how realistic your pipeline is and project future revenue.
-
Metric: Forecasted vs. actual revenue
-
Use it to: Sharpen leadership reports and investment timing
-
Action: Align on realistic targets with marketing
How to Set Up Your Funnel Dashboard in HubSpot
-
Go to Reports → Dashboards
-
Create new dashboard or use templates like Sales Manager Dashboard
-
Add custom reports:
-
Deal funnel
-
Lead source conversion
-
Stage time analysis
-
Forecast accuracy
-
-
Use filters:
-
Time periods (this month, quarter)
-
Pipeline type
-
Rep or team filters
-
-
Share with:
-
Sales managers (daily use)
-
Executives (weekly roll-ups)
-
Marketing (alignment syncs)
-
Business Impact: Why This Works
When CRM Magnetics set up funnel tracking for a mid-size B2B tech firm, they discovered a 46% drop-off between demo and proposal. The issue? Reps weren’t logging follow-ups. By adding task triggers and dashboard alerts, they reduced that drop-off by half in 90 days — boosting their close rate and shortening the sales cycle.
Final Thoughts
Your HubSpot funnel data tells a story. If you know how to read it, you’ll uncover exactly what’s working — and what’s not. With dashboards that highlight drop-offs, conversion rates, win rates, and time in stage, you’ll have the tools to optimize performance and revenue at every step.
Need help setting up actionable funnel dashboards? CRM Magnetics builds custom HubSpot reporting stacks that bring your data to life.
Leave your thought here
Your email address will not be published. Required fields are marked *